ExploreView Modes
View Modes
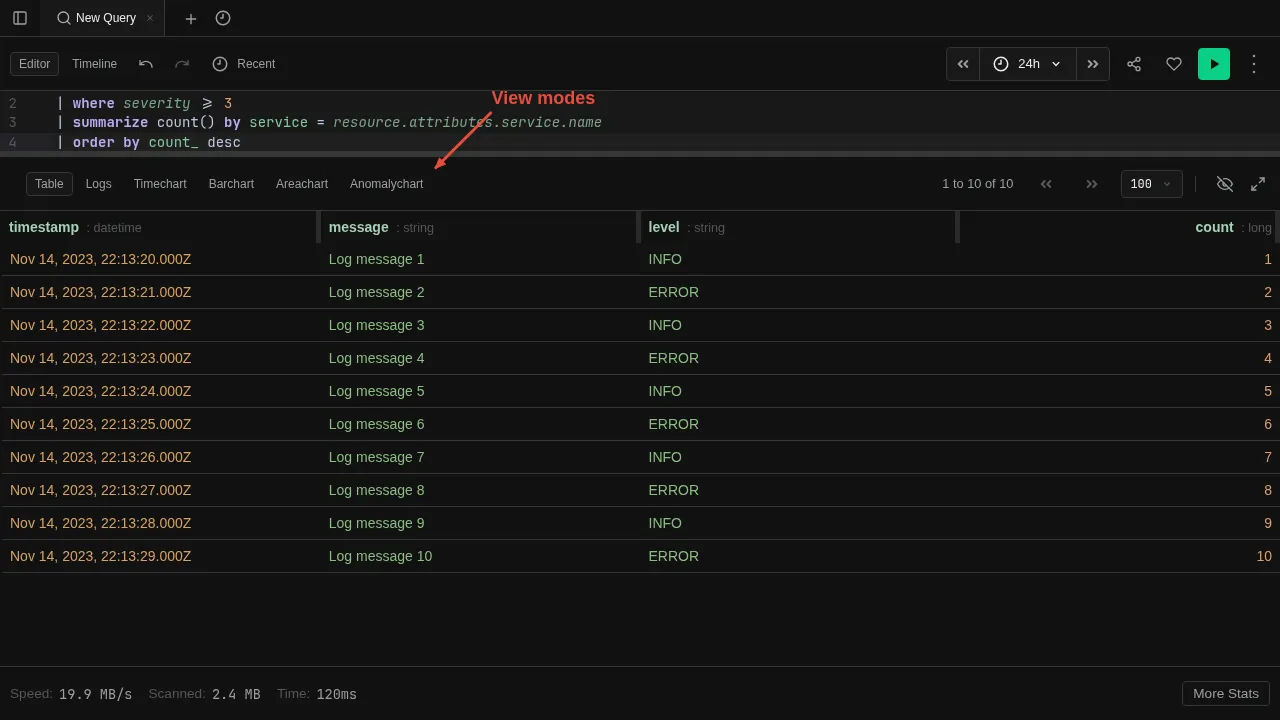
Display query results as tables, logs, traces, or charts
Results can be displayed in several modes, chosen from the toolbar above the results area.
| Mode | Best for |
|---|---|
| Table | Tabular results, column sorting, pagination |
| Logs | Log lines with expandable detail sidebar |
| Trace | Distributed trace tree |
| Timechart | Time-series line charts |
| Barchart | Categorical comparisons |
| Areachart | Stacked area charts |
| Anomalychart | Anomaly detection visualization |
The view mode is a display choice — it does not change the query. Switch modes freely to see the same result set in different ways.
To control which visualization is used automatically, see Visualizations.