ExploreView Modes
Anomalychart
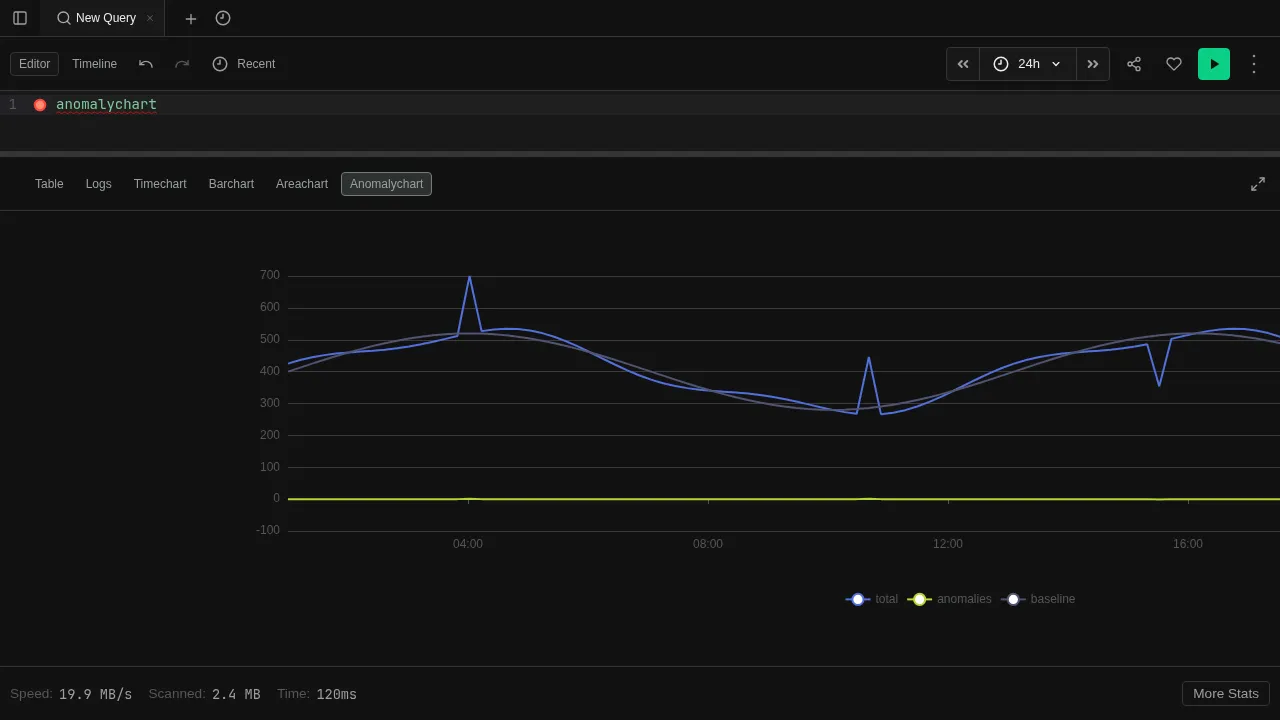
Anomaly detection visualization with highlighted outliers
The Anomalychart view is designed for anomaly detection output. It renders a time series with anomaly points highlighted, making it easy to spot deviations from expected behavior.
Try it
Use make-series to produce a time series, then apply series_decompose_anomalies to detect outliers:
default
| make-series count() on timestamp step 5m
| extend anomalies = series_decompose_anomalies(count_)
| render anomalychart
Features
- Anomaly highlighting — data points flagged as anomalies are visually distinct
- Baseline overlay — shows the expected baseline alongside actual values
- Interactive legend — toggle series visibility
- Auto-render — use
| render anomalychartto switch to this view automatically
See Visualizations for render options.