ExploreView Modes
Areachart
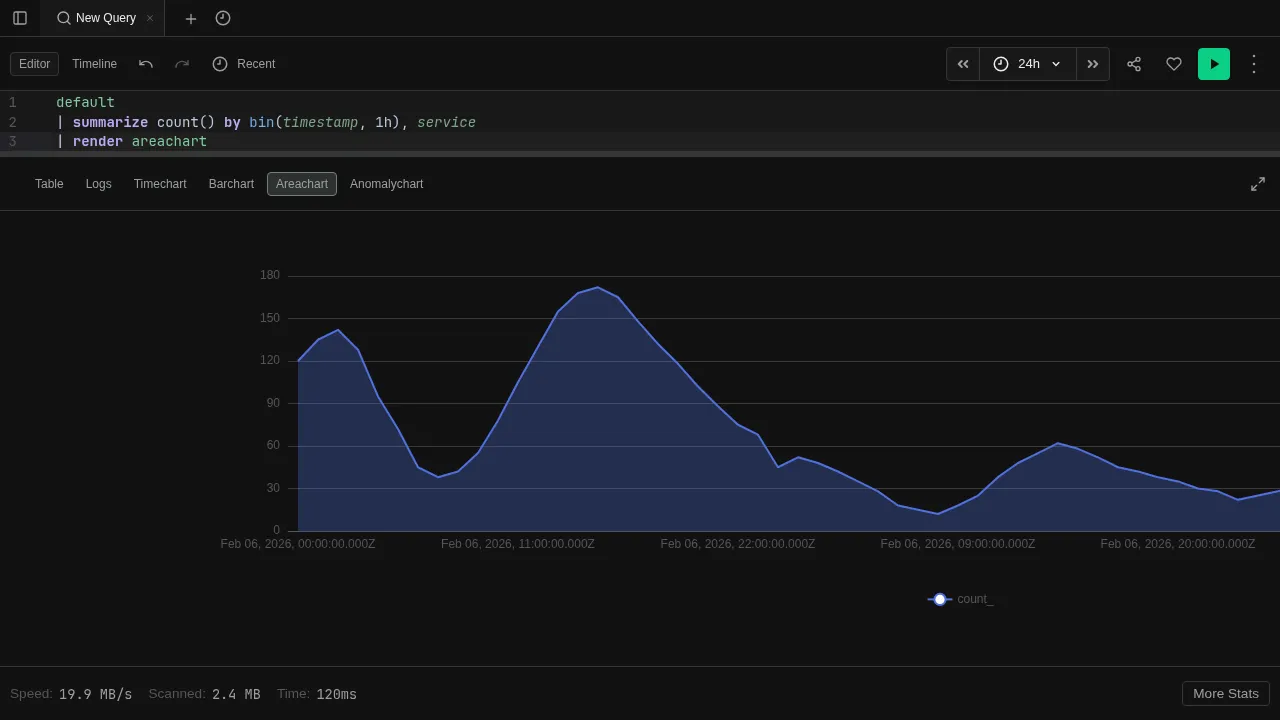
Stacked area chart for volume over time
The Areachart view renders results as filled areas under lines. Like Timechart, but with the area below each series filled in — useful for showing volume and how series contribute to a total.
Try it
datatable(timestamp:datetime, requests:long, service:string) [
  datetime(2024-01-01 00:00), 120, "api",
  datetime(2024-01-01 01:00), 150, "api",
  datetime(2024-01-01 02:00), 130, "api",
  datetime(2024-01-01 03:00), 170, "api",
  datetime(2024-01-01 00:00), 80, "web",
  datetime(2024-01-01 01:00), 95, "web",
  datetime(2024-01-01 02:00), 70, "web",
  datetime(2024-01-01 03:00), 110, "web"
]
| render areachart
Features
- Stacked series — each series fills the area under its line, stacking visually
- Interactive legend — click legend entries to show/hide individual series
- Tooltips — hover to see per-series values at a given time
- Auto-render — use
| render areachartto switch to this view automatically
See Visualizations for render options like title and ytitle.