ExploreView Modes
Logs
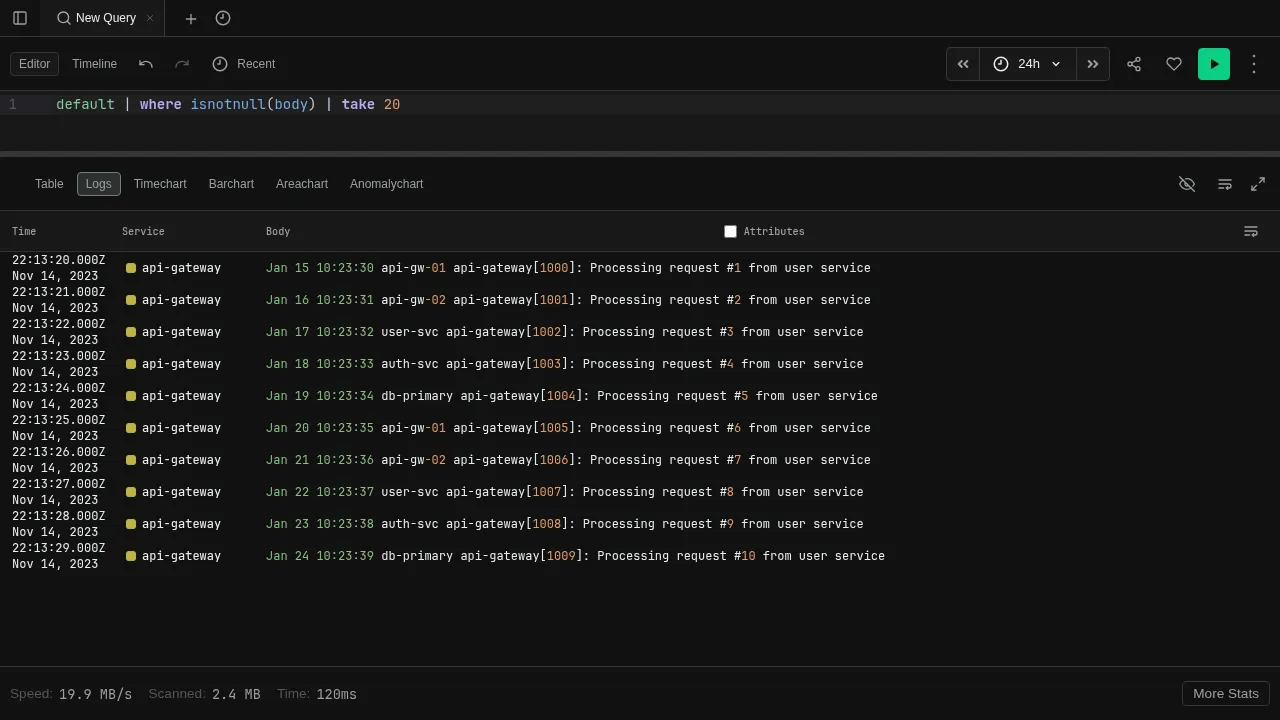
Log line display with expandable detail sidebar
The Logs view renders results as log lines — one row per entry with timestamp, service, severity, and message body. Click any row to open a detail sidebar showing all fields.
This is the same log display used in the Logging tab. The difference is how you get there: in Logging, you build queries with point-and-click filters; in Explore, you write KQL directly.
Try it
default
| take 50
Switch to Logs view in the toolbar to see the results as log lines.
Features
- Expandable sidebar — click a row to see all fields, resource attributes, and raw values
- Field actions — click field values in the sidebar to add filters or copy values
- Inline attributes — toggle the Attributes checkbox to show key fields inline
- Service pills — color-coded badges identify the originating service
For guided log exploration without writing KQL, see the Logging tab.